Quick answer
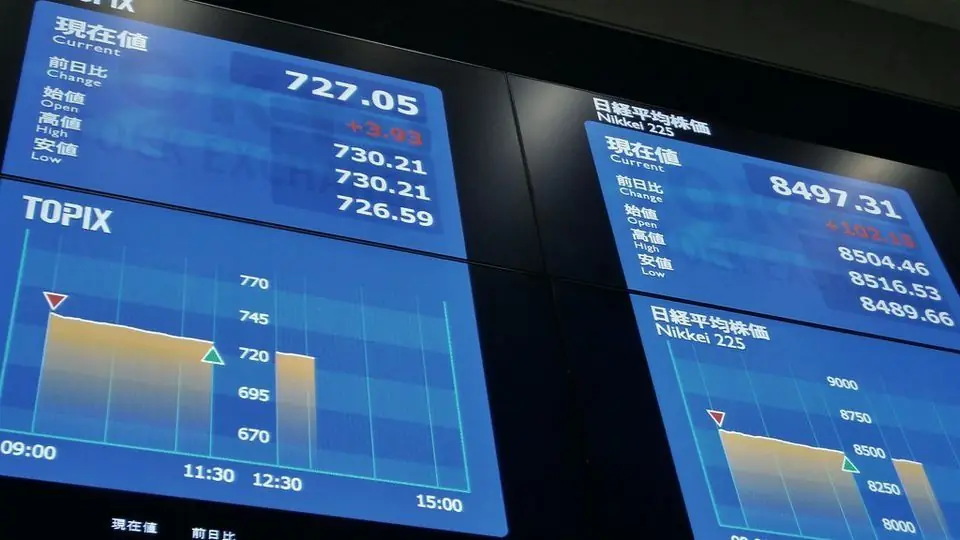
Volatility is how much prices swing up and down. FINRA notes that the more dramatic the swings, the higher the volatility and potential risk [1]. It is often measured with standard deviation or beta, and in the US extreme one-day falls can halt trading [2].
Key points
- Volatility describes the size of price swings, in both directions — not only falls.
- Two investments can have the same average return and very different volatility.
- Beta compares a stock's past swings with a benchmark index; a beta of 1.2 has historically moved 120% as much.
- US market-wide circuit breakers pause trading after S&P 500 falls of 7%, 13% and 20% in one day.
- Scammers are especially active in volatile periods; a plan set in calm times is the main defense against rushed decisions.
#What does volatility mean?
FINRA, the Financial Industry Regulatory Authority, puts it plainly: some days market indexes and stock prices move up and other days they move down, and "This is called volatility." It adds: "The more dramatic the swings, the higher the level of volatility—and potential risk" [1].
Volatility is about the size of moves, not their direction. A stock that jumps 8% one month and drops 5% the next is volatile even if it ends the year higher. A savings account that earns a small, steady amount has almost no volatility. For a short definition, see our glossary entry on volatility.
#How is volatility measured?
The most common measure is standard deviation: a number that shows how far individual returns tend to spread from their average. The bigger it is, the wider the swings. Our glossary explains standard deviation in more detail. The example below shows why the average alone can mislead.
Worked example
Same average, very different ride
Two hypothetical funds each start with $10,000. Over six months, Fund A returns 1%, 1%, 2%, 0%, 1%, 1%. Fund B returns 6%, −4%, 8%, −5%, 3%, −2%.
- Average monthly return: A / B
- 1.00% / 1.00%
- Standard deviation (sample): A / B
- 0.63 / 5.44 percentage points
- Worst month: A / B
- 0% / −5%
- Value after six months: A / B
- $10,614.16 / $10,538.72
Both funds averaged 1% a month, but Fund B's spread was more than eight times as wide and ended about $75 behind. Big ups and downs drag on compound growth, even when the average looks the same.
Hypothetical returns. Standard deviation and ending values calculated in Python (statistics.stdev and month-by-month compounding).
Standard deviation of monthly returns
A second measure is beta, which compares one stock's movements with a benchmark index that is given a beta of 1. FINRA's example: "A stock with a beta value of 1.2 has historically moved 120 percent for every 100 percent move in a benchmark index, such as the S&P 500" [1]. So if the index moved 5%, a stock with that beta would historically have moved about 6% (5 × 1.2). Beta is backward-looking; see beta for its limits.
| Measure | What it tells you | Limitation |
|---|---|---|
| Standard deviation | How widely returns spread around their average | Treats up and down swings the same |
| Beta | How much a stock has moved relative to a benchmark index | Based on past data; relationships change |
| Daily or monthly range | The gap between high and low prices over a period | Says nothing about the long-run trend |
#What are circuit breakers and when do they halt trading?
When prices fall very fast, US markets have automatic pauses. Investor.gov explains that market-wide circuit breakers are coordinated halts by the securities and futures exchanges, triggered by single-day falls in the S&P 500 Index at three levels: 7% (Level 1), 13% (Level 2) and 20% (Level 3) [2]. The trigger points "are calculated daily based on the prior day's closing price of the S&P 500 Index" [2].
| Level | S&P 500 fall in one day | What happens |
|---|---|---|
| Level 1 | 7% | 15-minute market-wide halt if triggered before 3:25 p.m.; no halt at or after 3:25 p.m. |
| Level 2 | 13% | 15-minute market-wide halt if triggered before 3:25 p.m.; no halt at or after 3:25 p.m. |
| Level 3 | 20% | Trading halts for the rest of the day, at any time |
Worked example
Where the triggers would sit
Suppose the S&P 500 closed yesterday at a hypothetical 5,000 points. Today's trigger levels are calculated from that close.
- Level 1: 5,000 × (1 − 0.07)
- 4,650
- Level 2: 5,000 × (1 − 0.13)
- 4,350
- Level 3: 5,000 × (1 − 0.20)
- 4,000
A fall to 4,650 before 3:25 p.m. would pause trading across the market for 15 minutes.
Hypothetical index level; calculated in Python.
Individual stocks have their own guardrail, called Limit Up-Limit Down. It sets price bands around a stock's recent average price; if the price moves outside its band and does not return within 15 seconds, trading in that stock pauses for five minutes [2]. Halts give people time to absorb information — they do not stop prices from falling further once trading resumes.
#How does volatility affect your orders?
In fast markets the price you see may not be the price you get. FINRA warns that when a stop order turns into a market order in volatile conditions, it "may be executed at a price that's significantly different from your stop price" [3]. The order types are compared in market vs limit orders. Wider bid-ask spreads are another hidden cost when prices move quickly.
#How can you stay steady when markets swing?
FINRA's guidance for turbulent markets centers on preparation: set clear, prioritized goals, stay diversified, and avoid impulsive decisions when markets become volatile [4]. It also lists keeping an emergency fund and paying credit card bills on time [1]. It also warns that in times of high volatility, investors may be especially vulnerable to fraud by "financial scammers touting guarantees of 'risk-free' returns" [1].
Before the next big swing
Write down your goal and time horizon
Money needed within a few years is usually kept away from volatile assets. See risk tolerance and time horizon.
Keep an emergency fund
Cash for surprises means you are not forced to sell during a drop. See emergency fund.
Decide in advance what you will do
Rules set in calm times — such as rebalancing on a schedule — are easier to follow than decisions made under stress.
Check before you act on a hot tip
Volatile markets attract scams. Verify anyone offering advice before sending money.
Common beginner mistakes
Treating volatility as only the downside
Volatility measures swings in both directions. Sharp rises can be followed by sharp falls.
Comparing investments only by average return
As the example shows, two investments with the same average can end at different values and feel very different to hold.
Placing market orders during a fast move
In volatile moments, a market order can fill well away from the last price you saw [3].
Assuming a halt means the bottom
Circuit breakers pause trading; they do not set a floor. Prices can keep falling after trading resumes.
What's the bottom line?
Volatility is the size of price swings, measured most often by standard deviation and beta. In the US, circuit breakers pause trading during extreme single-day falls, but they do not stop losses. The steady response — clear goals, diversification, an emergency fund and careful order types — works whatever the market does next. For longer swings, see bull and bear markets explained.
Frequently asked questions
Is high volatility always bad?
Not by itself. Volatility means larger swings in both directions. It matters most when you may need to sell during a downswing, which is why time horizon is central.
How often do market-wide circuit breakers trigger?
They are designed only for severe single-day declines in the S&P 500 — at least 7% from the prior close. The trigger levels are recalculated each day from the prior day's close.
What is the difference between a halt and a pause?
A market-wide circuit breaker halts trading across the market for 15 minutes or for the rest of the day. A Limit Up-Limit Down pause applies to a single stock for five minutes.
Can I measure volatility myself?
Yes. Collect a series of returns, such as monthly percentage changes, and calculate their standard deviation in a spreadsheet. Compare investments over the same period.
Sources
Grade A = primary source (regulator, government agency, official rulebook or the index provider's own documents). Numbers in brackets in the text point here.
- FINRA. Volatility (2026). Accessed 2026-10-03.A
- U.S. SEC — Investor.gov. Stock Market Circuit Breakers (glossary) (2026). Accessed 2026-10-03.A
- FINRA. Stop Orders: Factors to Consider During Volatile Markets (2026). Accessed 2026-10-03.A
- FINRA. Investor Tips for Turbulent Markets (2026). Accessed 2026-10-03.A
This page is general education, not personal financial, tax or legal advice. Figures in worked examples are hypothetical and calculated before taxes and fees unless stated. Rules and limits change; check the linked primary sources for the current version. How we check every page.