
Markets & Economy
What is a stock market index?
"The market" in the news is usually an index. Here is what an index measures, and why the way it is weighted changes what it tells you.
Independent investing education · No ads · No affiliate links · Not financial advice
This section explains the big forces behind market headlines. When a news report says "the market fell 2%," it is usually talking about a stock market index — a basket of companies measured as one number.
Markets & Economy
"The market" in the news is usually an index. Here is what an index measures, and why the way it is weighted changes what it tells you.
Markets & Economy
Markets & Economy

7 min read
6 min read
6 min read
3 published
Markets & Economy
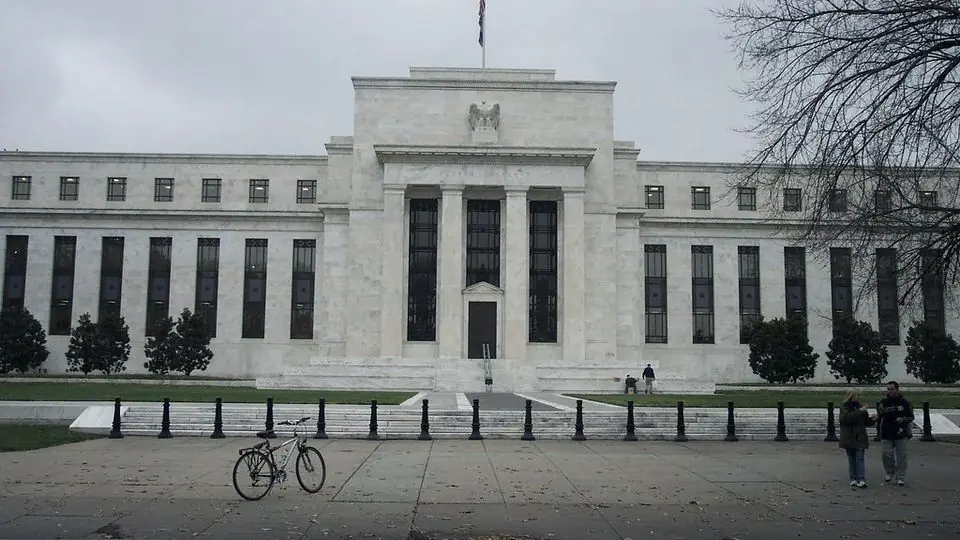
Rate decisions move markets because they change what future money is worth today. Here is the chain from the Fed's meeting room to a share price — without any forecast.
Markets & Economy
Prices swing every day. Here is how to measure those swings, what happens when they get extreme, and why a calm plan matters more than a forecast.
This section explains the big forces behind market headlines. When a news report says "the market fell 2%," it is usually talking about a stock market index — a basket of companies measured as one number. When it says rates went up, it means the cost of borrowing changed, which affects how much investors are willing to pay today for money a company may earn later. And when prices swing sharply from one day to the next, that is volatility: a normal feature of markets, even if it feels alarming. Each guide defines its terms the first time they appear and works through the numbers step by step.
We do not predict where markets will go next, and nothing here is a recommendation to buy or sell. The goal is to help you read the news calmly and understand what is actually being measured. If you are brand new, start with what an index is, then how interest rates connect to stock prices, then what volatility does and does not tell you. Where a guide uses a figure or a rule, it links to the official source — the SEC's Investor.gov, the Federal Reserve or the Bureau of Labor Statistics — so you can check it yourself.
Start with the measuring stick, what a stock market index is, because most market news is reported as an index move. Market volatility explained describes how large and how fast those moves can be, and how interest rates affect stocks covers one of the main economic forces behind them.